.svg)

Filtering Techniques in QuickSight | West Loop Strategy
.jpeg)
One of the greatest features QuickSight has to offer is it’s easy user interface. You can customize your dashboards to almost any way you like.
A huge part of this user interface is being able to filter each visual to specifically what you are looking for and a click of a button. This ability to filter all visuals is something that can save you hours of work and also provide extremely clean visuals around your data.
While this is great, it sometimes can be difficult to set up properly. Today we are going to walk through two ways to make dynamic filtering for your visuals. Stay tuned because the second process is a little known feature that will make your life a lot easier if you are looking to add dynamic filtering to your dashboard.
First Process: Parameters
A good solution to dynamically filter your visuals is to create parameters and controls. Let’s look at how you do this.
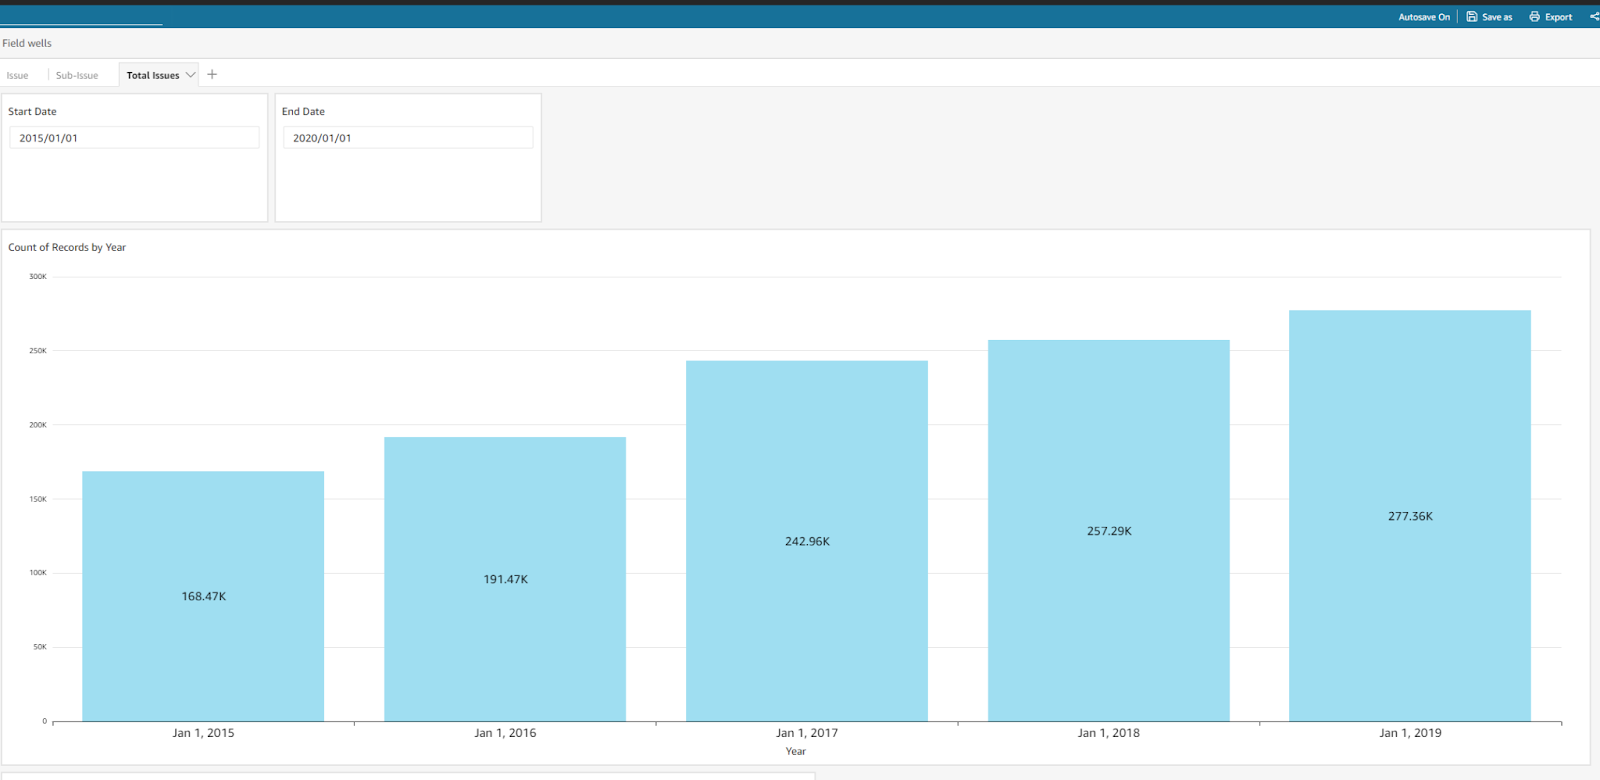
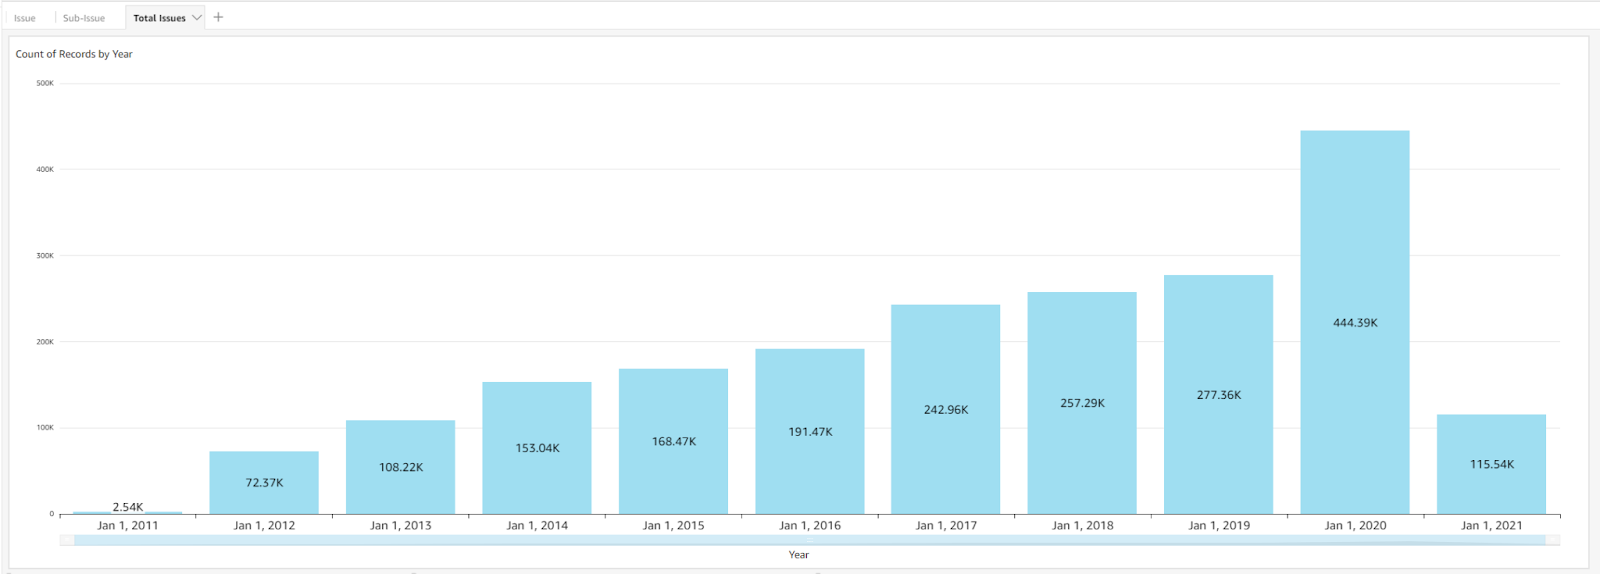
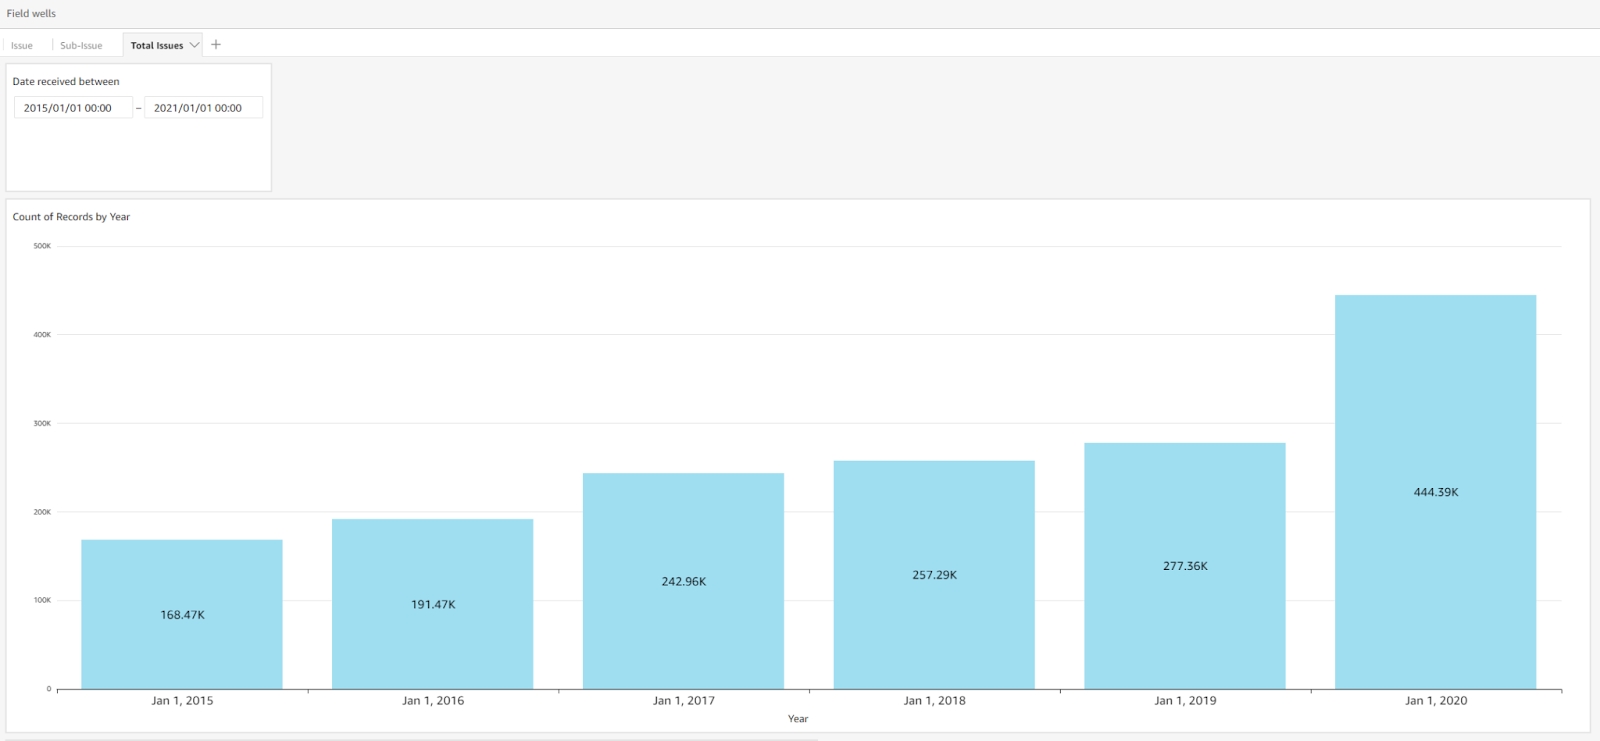
Say I want to be able to toggle between dates. Let’s look at a basic graph that shows some data over the years.
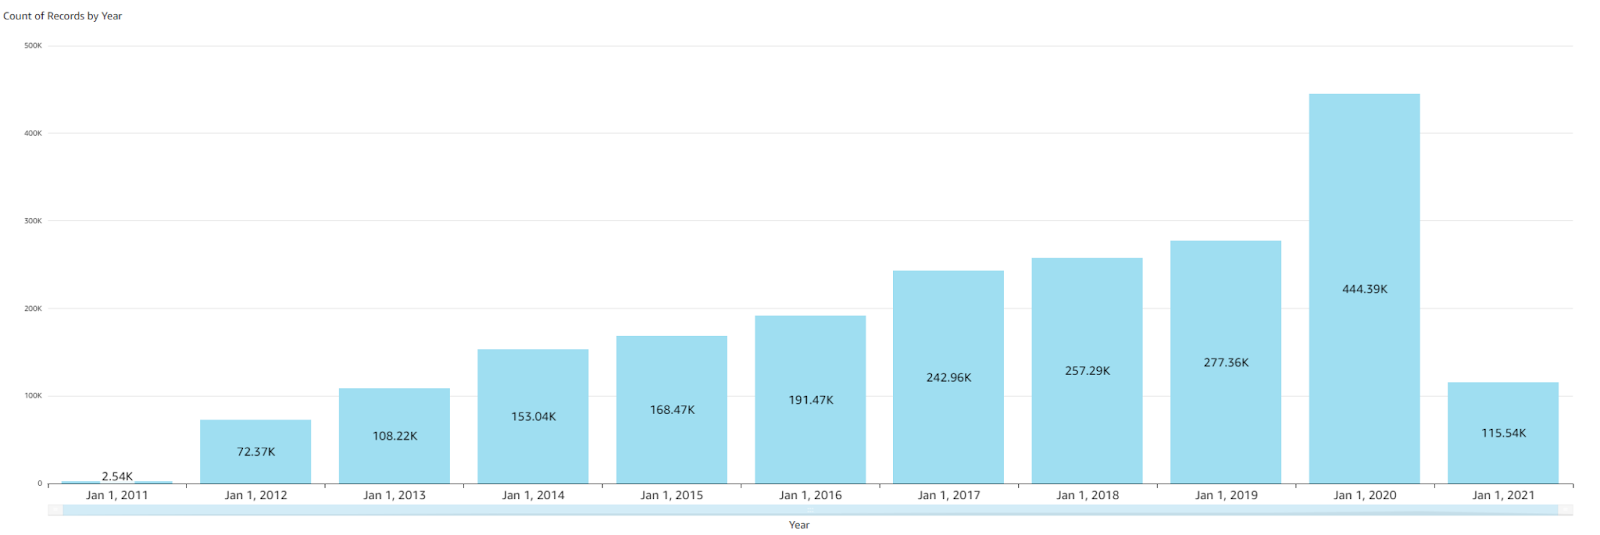
What if I want to filter from 2015 to 2020? What if tomorrow I want to filter from 2017 to 2020. I want to be able to do that easily, without having to constantly change filters on the backend. Let’s see how we can accomplish this.
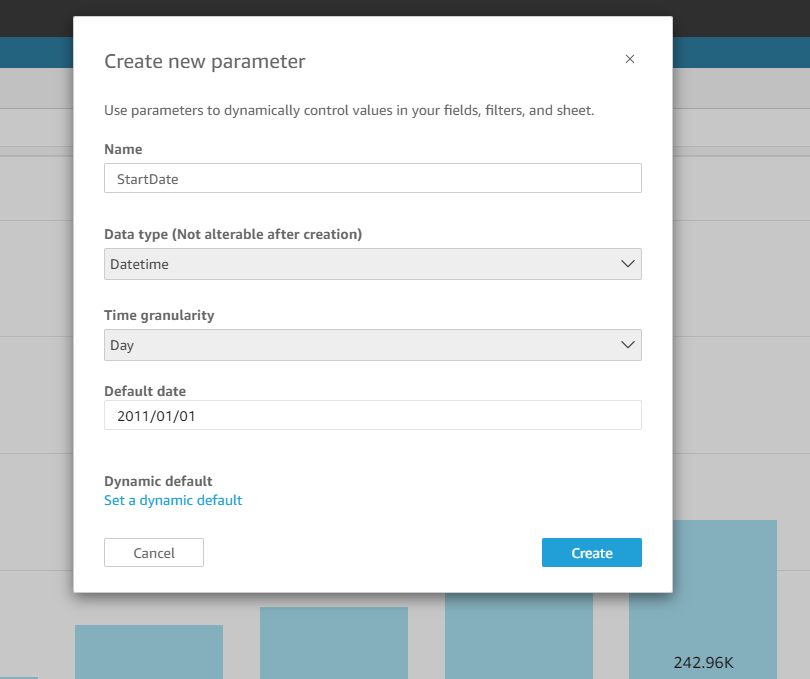
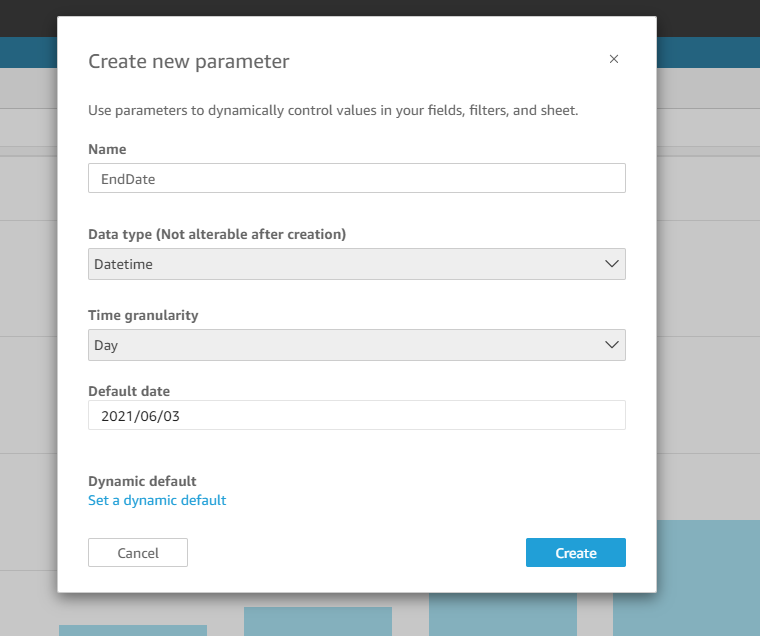
First, we’ll start by making two parameters. One for the start date and one for the end date because I want to be able to easily toggle between both.
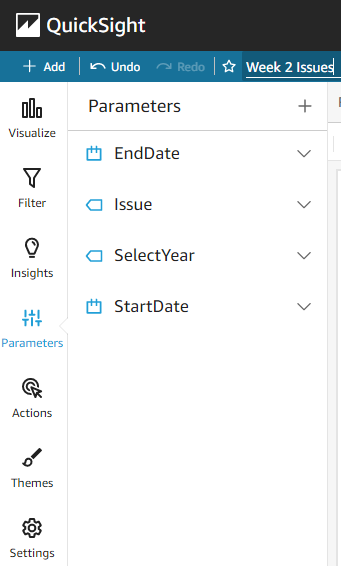
Click create new parameter and create the two separate parameters with these fields below.
Then we can click on the parameters and add their controls to the page. We should see them on the top of the tab here.

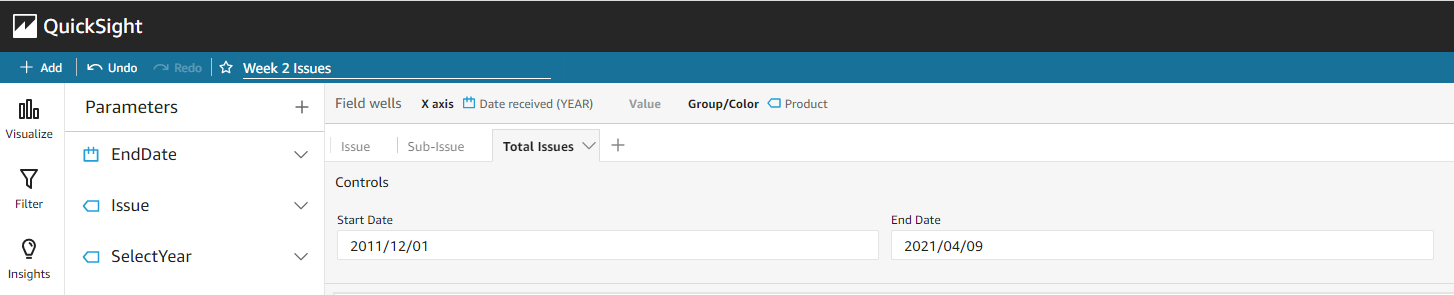
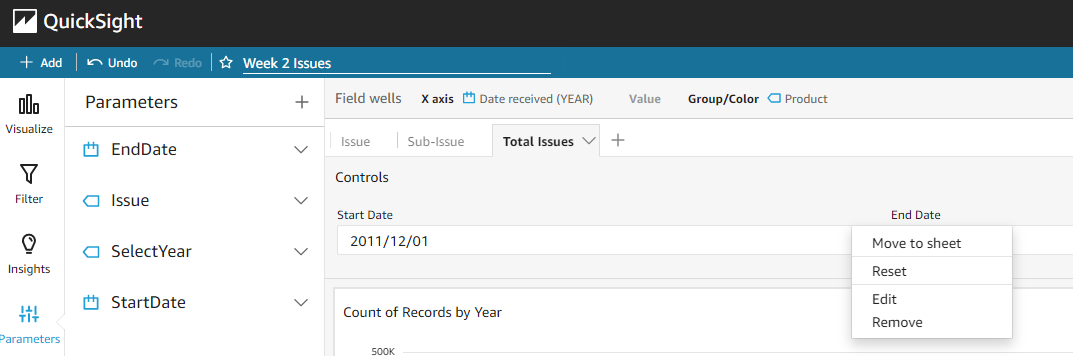
Next we can move them to the sheet to make our tab look much nicer and easier to use.
Ok, so we have that set up. Now, we need to tell our graph to filter on these parameters we just set up.
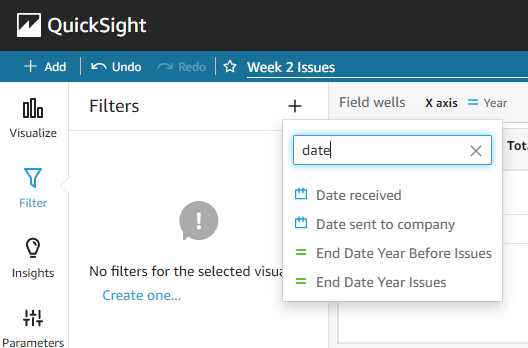
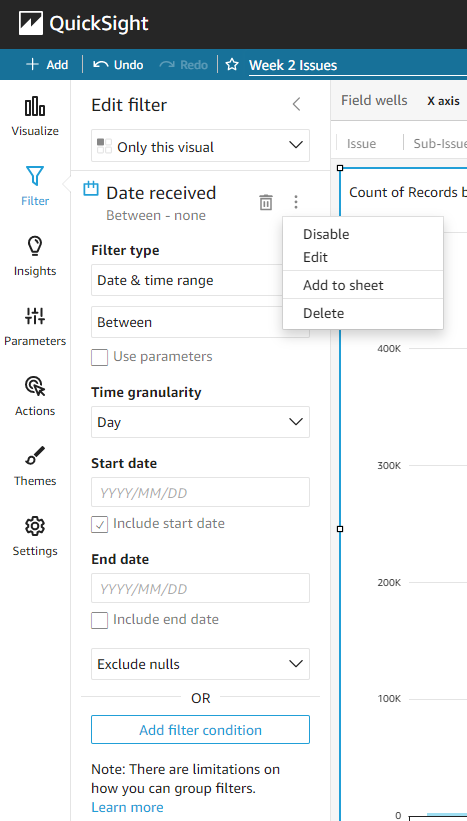
First, click on the graph to tell QuickSight we want to look at this visual. After clicking on the visual, we go to the filtering tab and add a filter. For this case we are using the date received field as the fields that we are referencing in our visual. Create a filter using that.
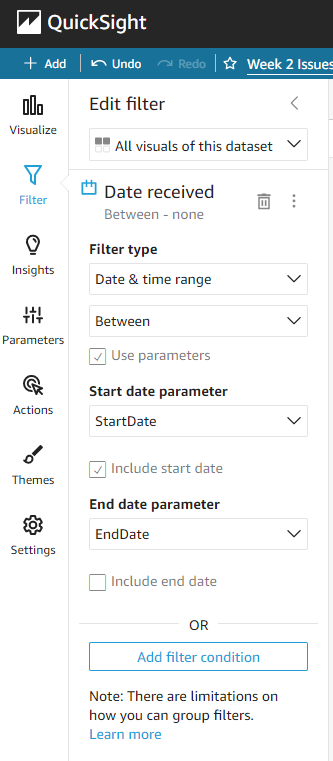
Once we have created a filter, go into and edit the filter. The default settings will be Date & time range and Between. We are going to stick with those. Then click on “Use parameters” a pop up will come up and click through that. Then the two parameters will say Start date parameter and End date parameter. Select the StartDate parameter and EndDate parameter for the filters respectively. Finally, at the bottom of your screen (right below this photo), click Apply! You’re all set to start toggling with these parameters.
We said we wanted to look at the ranges from 2015 to 2020 right? Let’s easily do that. Go into your new controls and click through the dates.
Now our graph can be filtered for the exact dates we want to! That wasn’t too hard was it?
Second Process: All Of The Above… In Two Simple Steps
Want to know how to do all of that in two steps and have the UI look a lot better for your team and your clients? And... we can do all of that in two simple steps.
Let’s start over with the same graph. I’m going to start over fresh. We’ll delete the previous filter we created and get rid of the controls on the page.
Ok, first click on the graph to let QuickSight know we are looking at this graph. Then go to create a filter.
Our first step is to create a new filter. We’re going to do the same thing we did before on making the filter on the “Date received” field and keep the filter type at “Date & time range” with the between fitler.
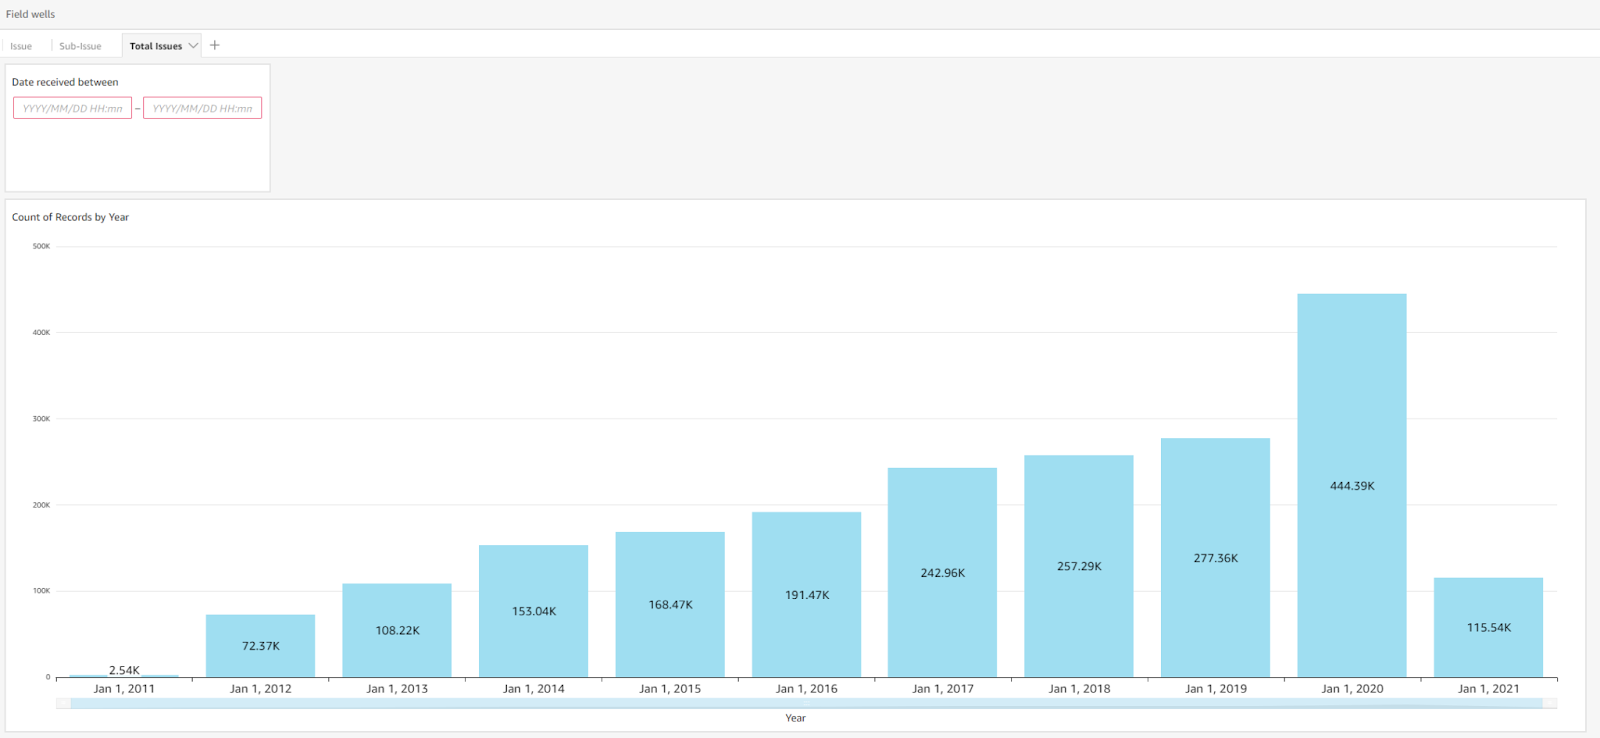
Second and final step. Ok ready? Now click on the three dots next to the trash to the right of the header on the fitler where it says “Date received”. Then click on the third line where it says “Add to sheet”.
Look at your dashboard. The filters are right there! See if it works and input the same dates we looked at before (2015-2020)
It’s the exact same! How amazing is that?! Didn’t that take us so much less time and work to do exactly what we were trying to do in the first place?
You can apply this to any visual and any fitler. Instead of having to create a parameter, make sure the input type is correct, then filter on that parameter…. It can all be automated by simply clicking on that “Add To Sheet” feature of the filters!
Parameters are still very useful for keeping other tabs filtered on some data. So if you want all of your tabs to be the same filter when you change a filter, then parameters are the best way to do that. They are also the only way we are able to use actions and allow click through of data to be referenced on other tabs, or the same tab.
However, if you are simply looking to filter specific visuals on one tab with the ease of use that controls give you. This is an amazing feature Quicksight has.
Conclusion
We hope this saves you some time and energy if you did not already know how to use these features. We believe filtering is one amazing feature Quicksight has so we wanted to share it with you all! It’s something that we use everyday and is very helpful for us and our clients.
Continue to work with both of these methods and let us know how you like them!
Thank you for your time, and see you soon for more QuickSight help, features and interesting use cases!