.svg)

Parameters, Controls, & Toggles in QuickSight | West Loop Strategy
Interactive toggles can provide powerful user experiences for analytics dashboards. In many cases, they are necessary for gaining insights into smaller subsections of a dataset.
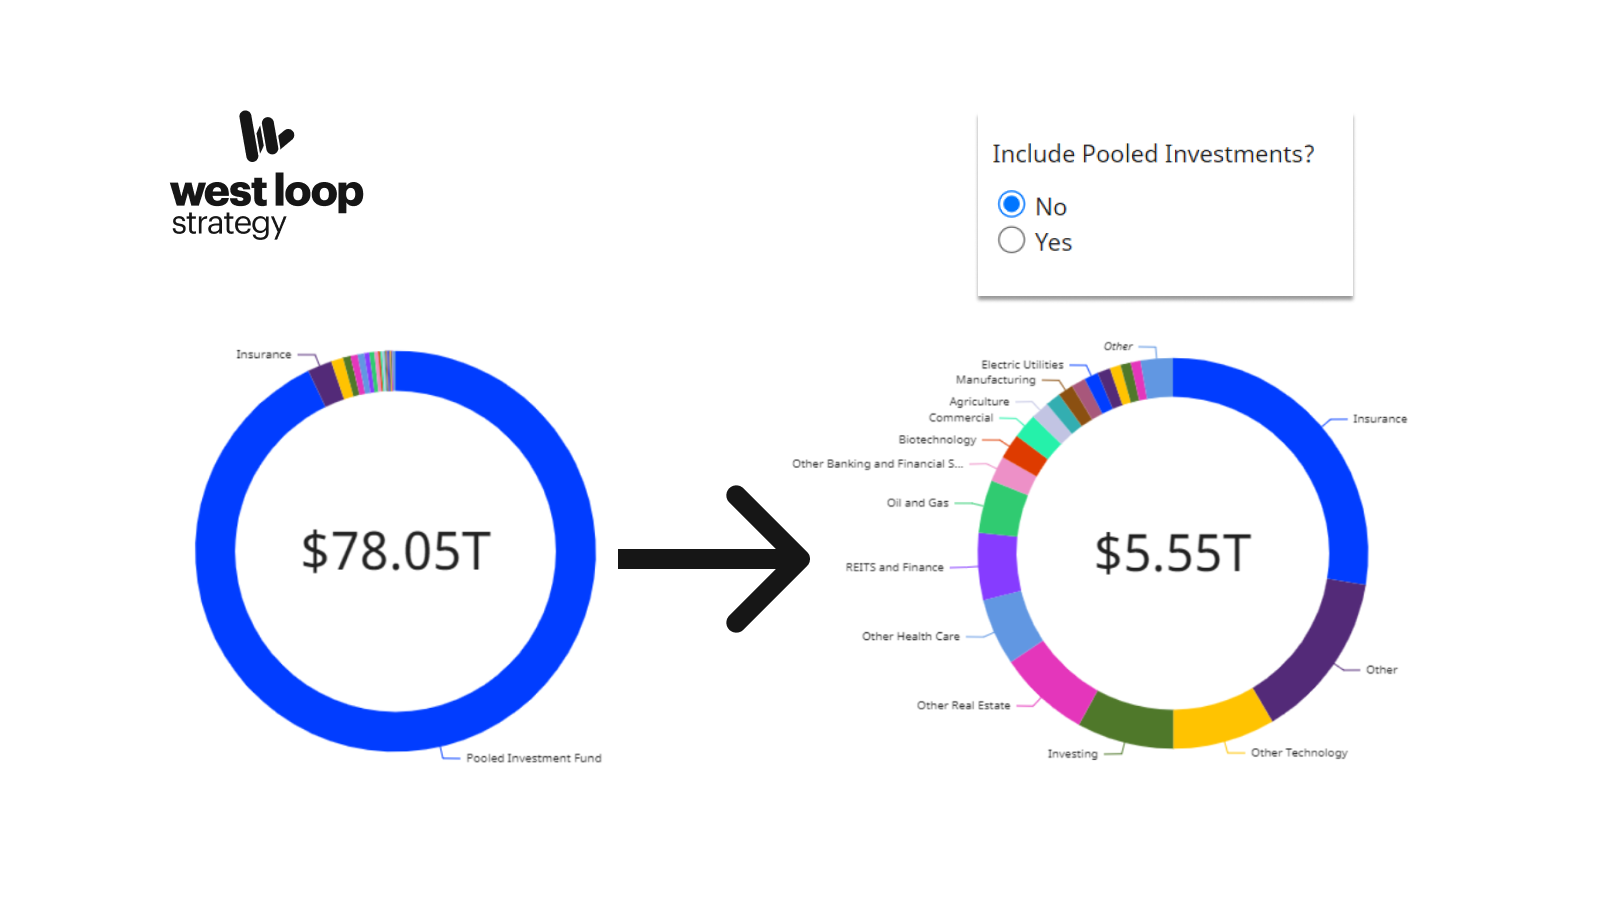
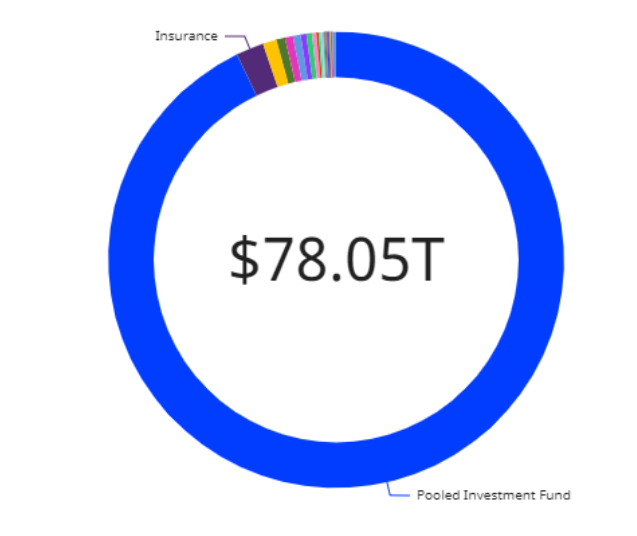
Consider this: Like our analysts when studying Form D, you are tasked with analyzing over a decade's worth of private security sales only to find that over 90% of sales are attributed to one industry group called “Pooled Investment Fund.” You want to showcase two visuals in one – allowing users to toggle between one visual with Pooled Investment Funds included and one without. In this tutorial, we will show you how to create a control that allows users to toggle between two different views for the same visualization.
Let’s start by adding a parameter called “PooledInvestment.”
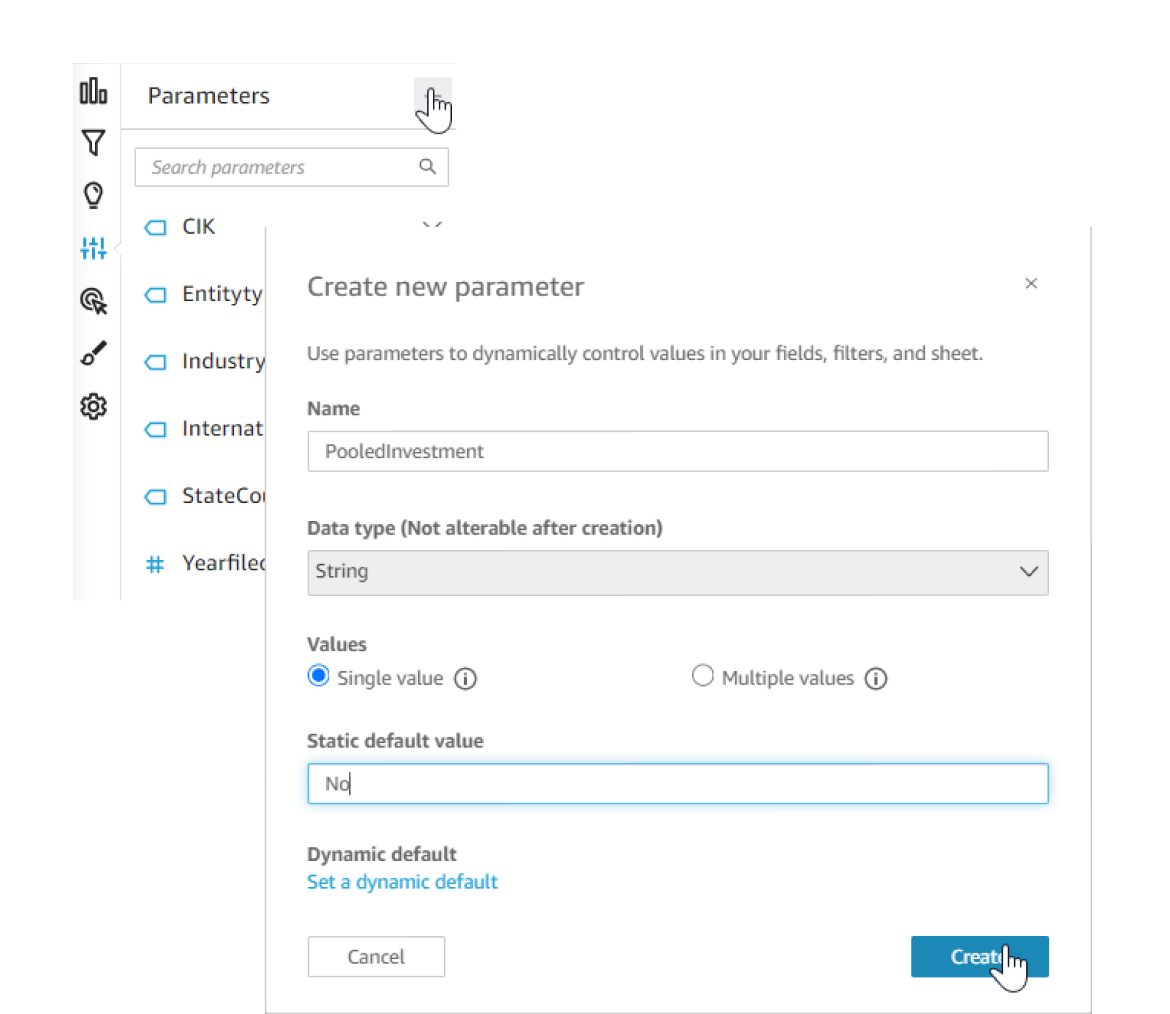
As we create our parameter, let's add a static default value of “No” so that when we get everything wired correctly our visualization will automatically filter out Pooled Investments. Now we need to add a control:
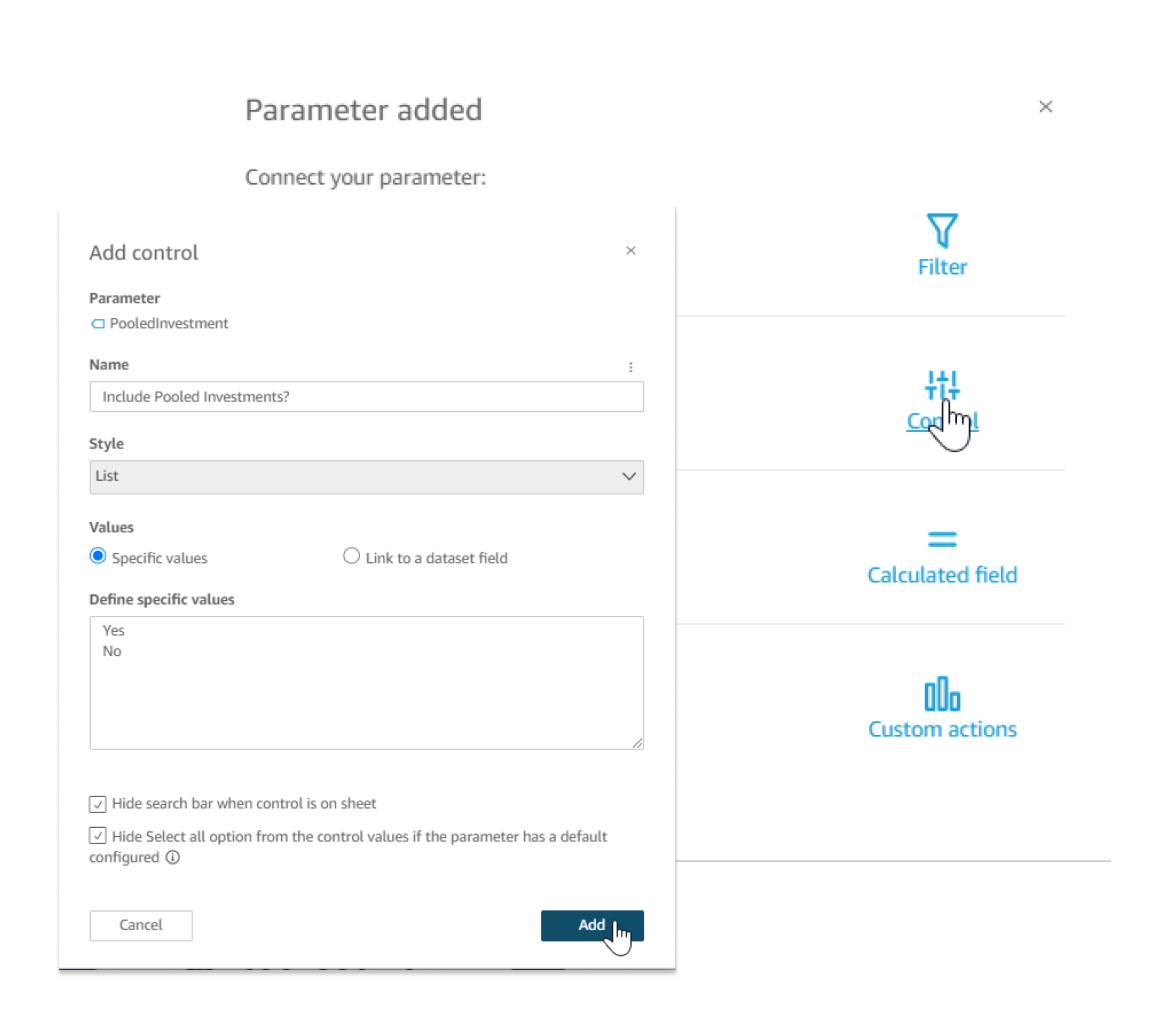
For our control, we first need to connect the PooledInvestment parameter we created. Then we need to give our control a name, which will appear on the toggle once we are finished – in this case let’s call the control “Include Pooled Investments?” because that will make the most sense to a user. Next, we will define the values we want to present in our control – in this case we will present a binary toggle of “Yes” and “No.” Finally, we will opt into hiding the search bar and “Select all” option because we only want to give our users two options that are mutually exclusive.
After clicking “Add,” you will be directed back to your QuickSight analysis. From here look to the top of the page, you should see your control hiding near the field wells:
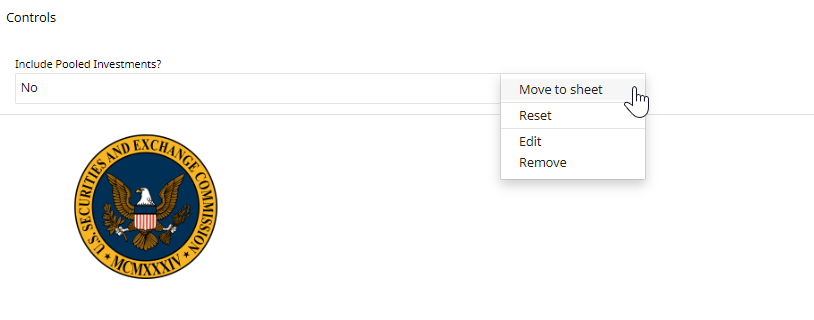
From here, go ahead and move your control to your sheet and drag it next to your visual.
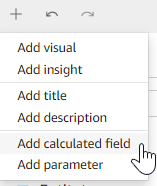
Now you can toggle between yes and no, but wait… the toggle isn’t doing anything! To get our toggle to work properly, we need to add a calculated field. On the top-left of your screen press the “+” button and select “Add calculated field”
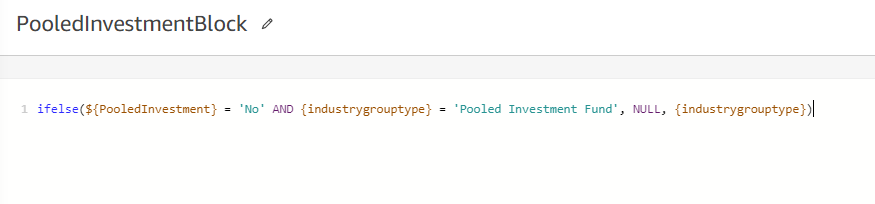
Now we want to think through the logic behind our toggle. What do we want to happen? Well, when a user selects “No” we want Pooled Investments to disappear and when a user selects “Yes” we want the visual to return what it normally would. Let’s attack this problem with an “ifelse” statement:
Let’s take a deeper dive into the statement written above:
ifelse(${PooledInvestment} = ‘No’ AND {industrygrouptype} = ‘Pooled Investment Fund’, Null, {industrygrouptype})
What this is saying is “if the PooledInvestment parameter that we defined earlier has a value of “No” AND the industrygrouptype field we are using to display industry types has a value of “Pooled Investment Fund” THEN present a value of Null, ELSE present the industry value.
After creating this calculated field, we need to replace our “industrygrouptype” filed with the new “PooledInvestmentBlock” field in the field wells at the top of the page:

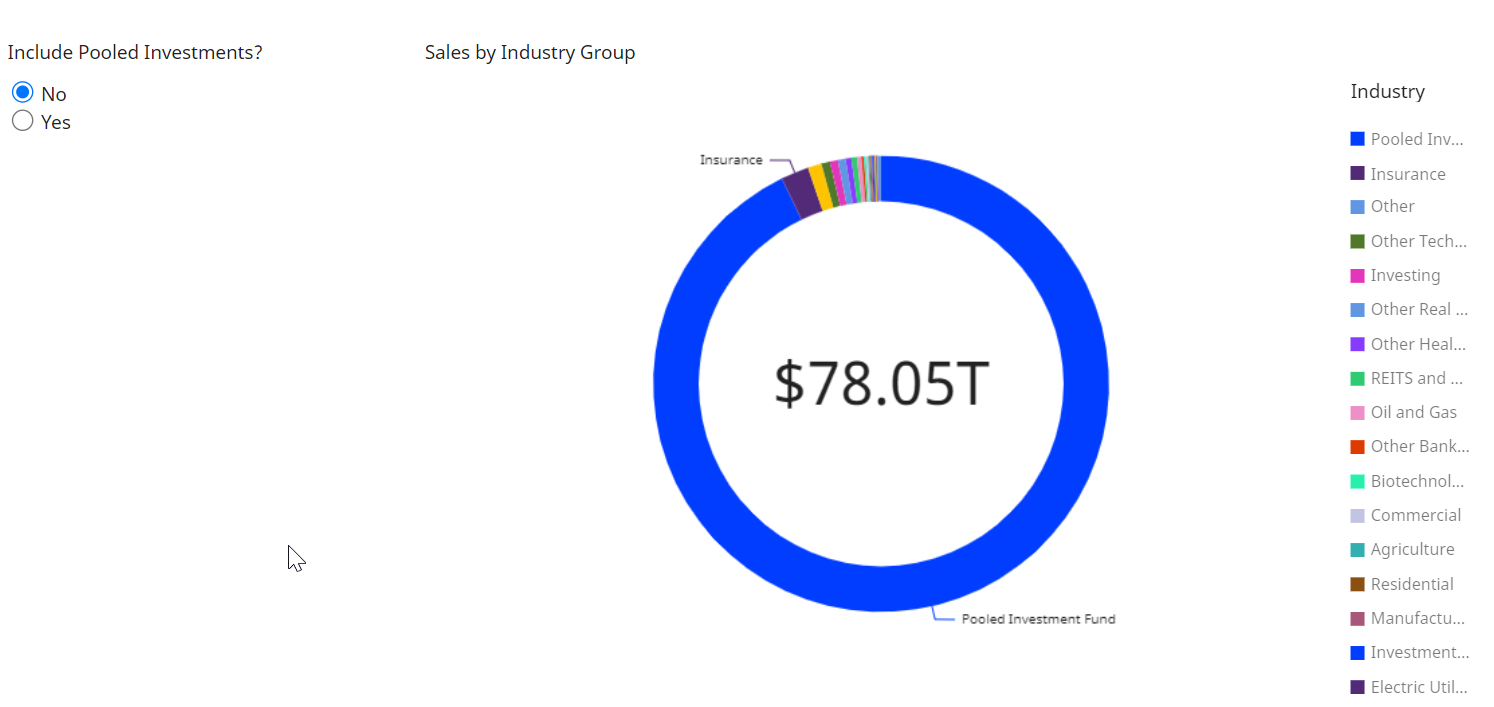
Now let’s look at our toggle to see what happens when we select No:
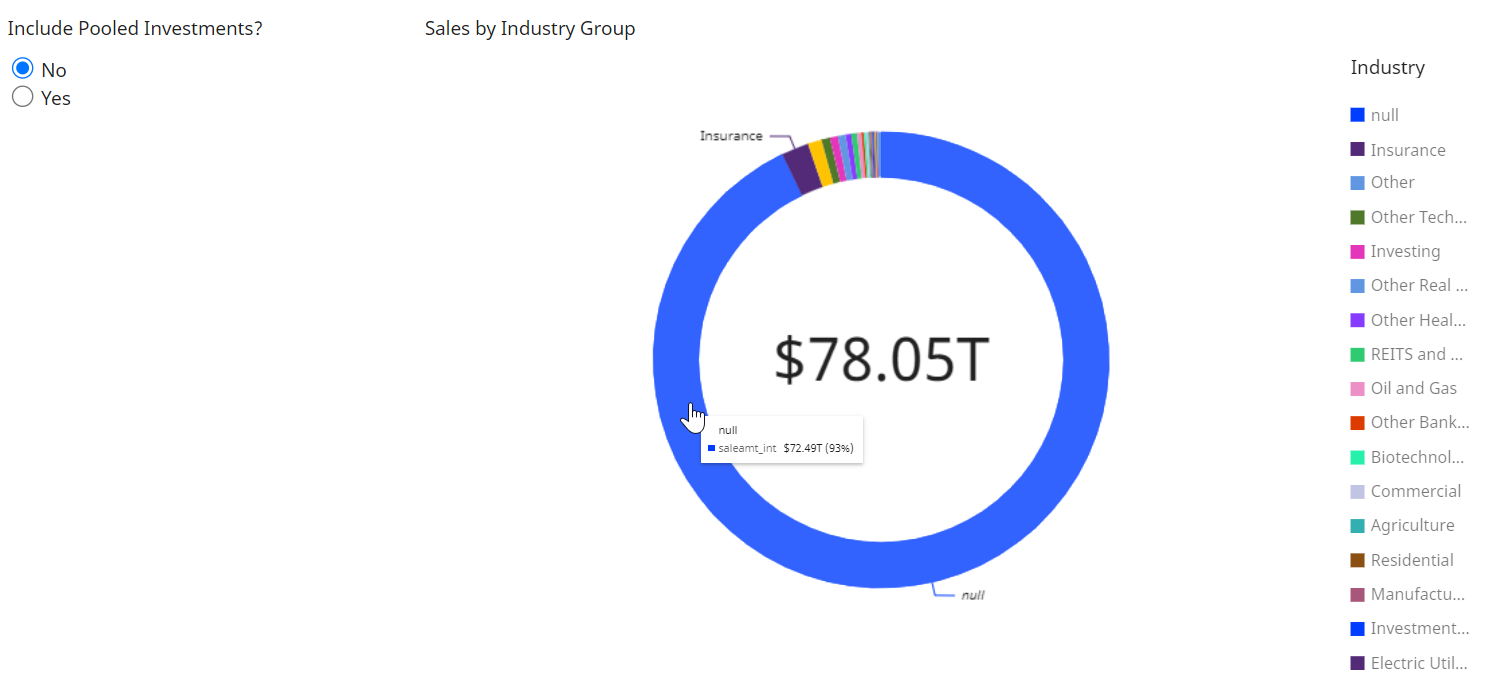
What the heck? You might be wondering why the visual looks the same as it did before after all of that work. Well if we take a closer look, you will notice that instead of Pooled Investment Funds making up over 90% of sales, we now see that “null” is the dominant industry category.
If you think back to our calculated field, we said “THEN present a value of Null.” What do we see here? Our calculated field is working perfectly!
We have one final step to get the visual to look exactly how we want. We need to add a filter for our calculated field PooledInvestmentBlock that excludes Null values:

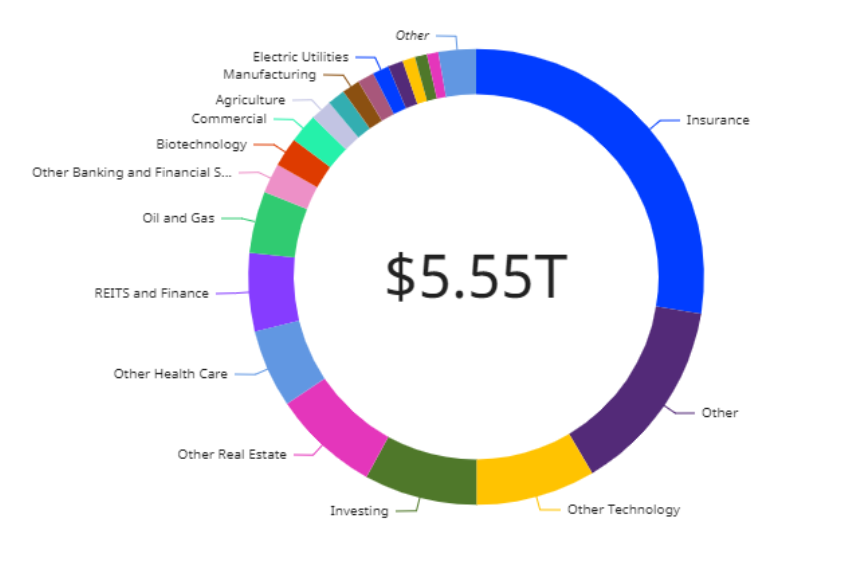
Now our toggle should work properly – take a look!
Thank you for reading this tutorial on binary toggles for QuickSight.
If you are interested in QuickSight consulting services, connect with us here! We would be happy to help you with all things QuickSight!