.svg)

Custom KPI Creation in QuickSight | West Loop Strategy

Making Time Of The Essence
If I told you I ran a 539 second mile what would you say? Is that good, bad? What if google maps told you that it would take 12,630 seconds to get to your favorite destination? Wouldn’t it make more sense if I told you I ran a mile in 8 minutes and 59 seconds? Or that google told you it would take 3 hours 30 minutes and 30 seconds? That’s a no brainer!
However, when getting data, raw data like the amount of seconds something took works a lot better. We can change numbers into average, sums, max, mins, etc. So how can we get the best of both worlds by using numbers to calculate, but presenting that final number in our unique way?
Starting With The Number
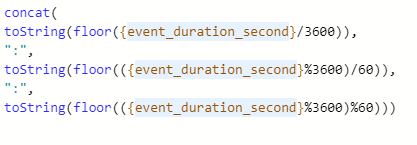
First, let's start by having a data field that will represent the total amount of seconds spent doing a task. In the end, we are going to try and present this number in a stopwatch type of format. It’s going to look like 3:30:30 and represent 3 hours, 30 minutes, and 30 seconds. If we have a total amount of seconds as an integer, we can calculate all of this and present it very nicely! The total amount of seconds will be called event_duration_second. And to make the format, we can create a calculated field as such.
Link is provided here to check out the math!
What this calculated field is doing is getting the hour, minute and second and putting it into the string format we want. We’ve labeled our calculated field “Event Duration Time Format”. Now let’s see how we can display it. Let’s start with trying to make it a KPI.
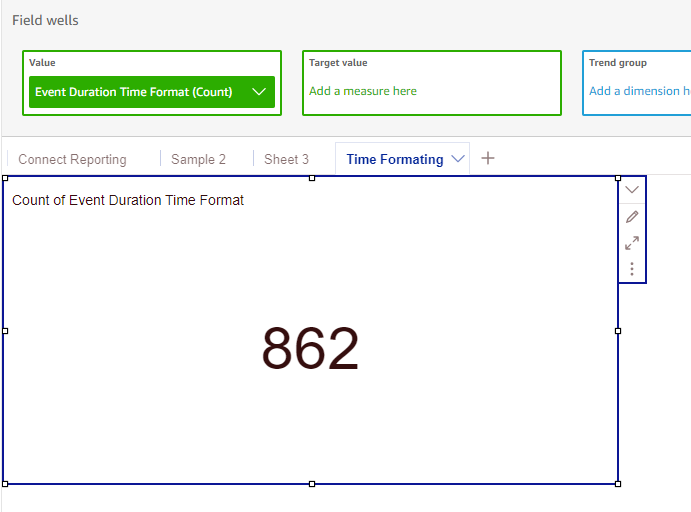
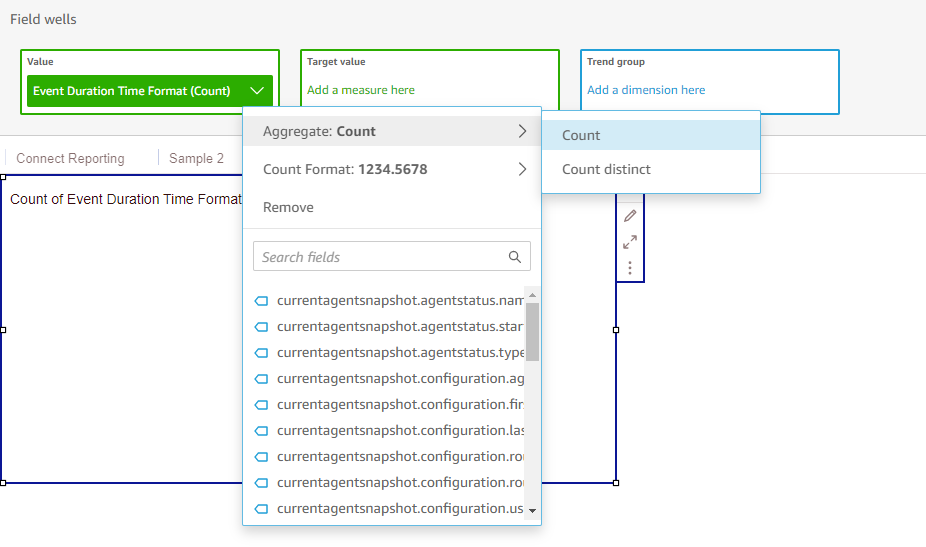
If we try to make a KPI it’ll show this. It’ll only show us a count or a count distinct. That is because KPI needs numbers to report on. If they are strings, like our calculated field here, KPIs in quicksight can only look at their counts because a string is not a number.
How can we show the sum of our newly calculated field?
Insights
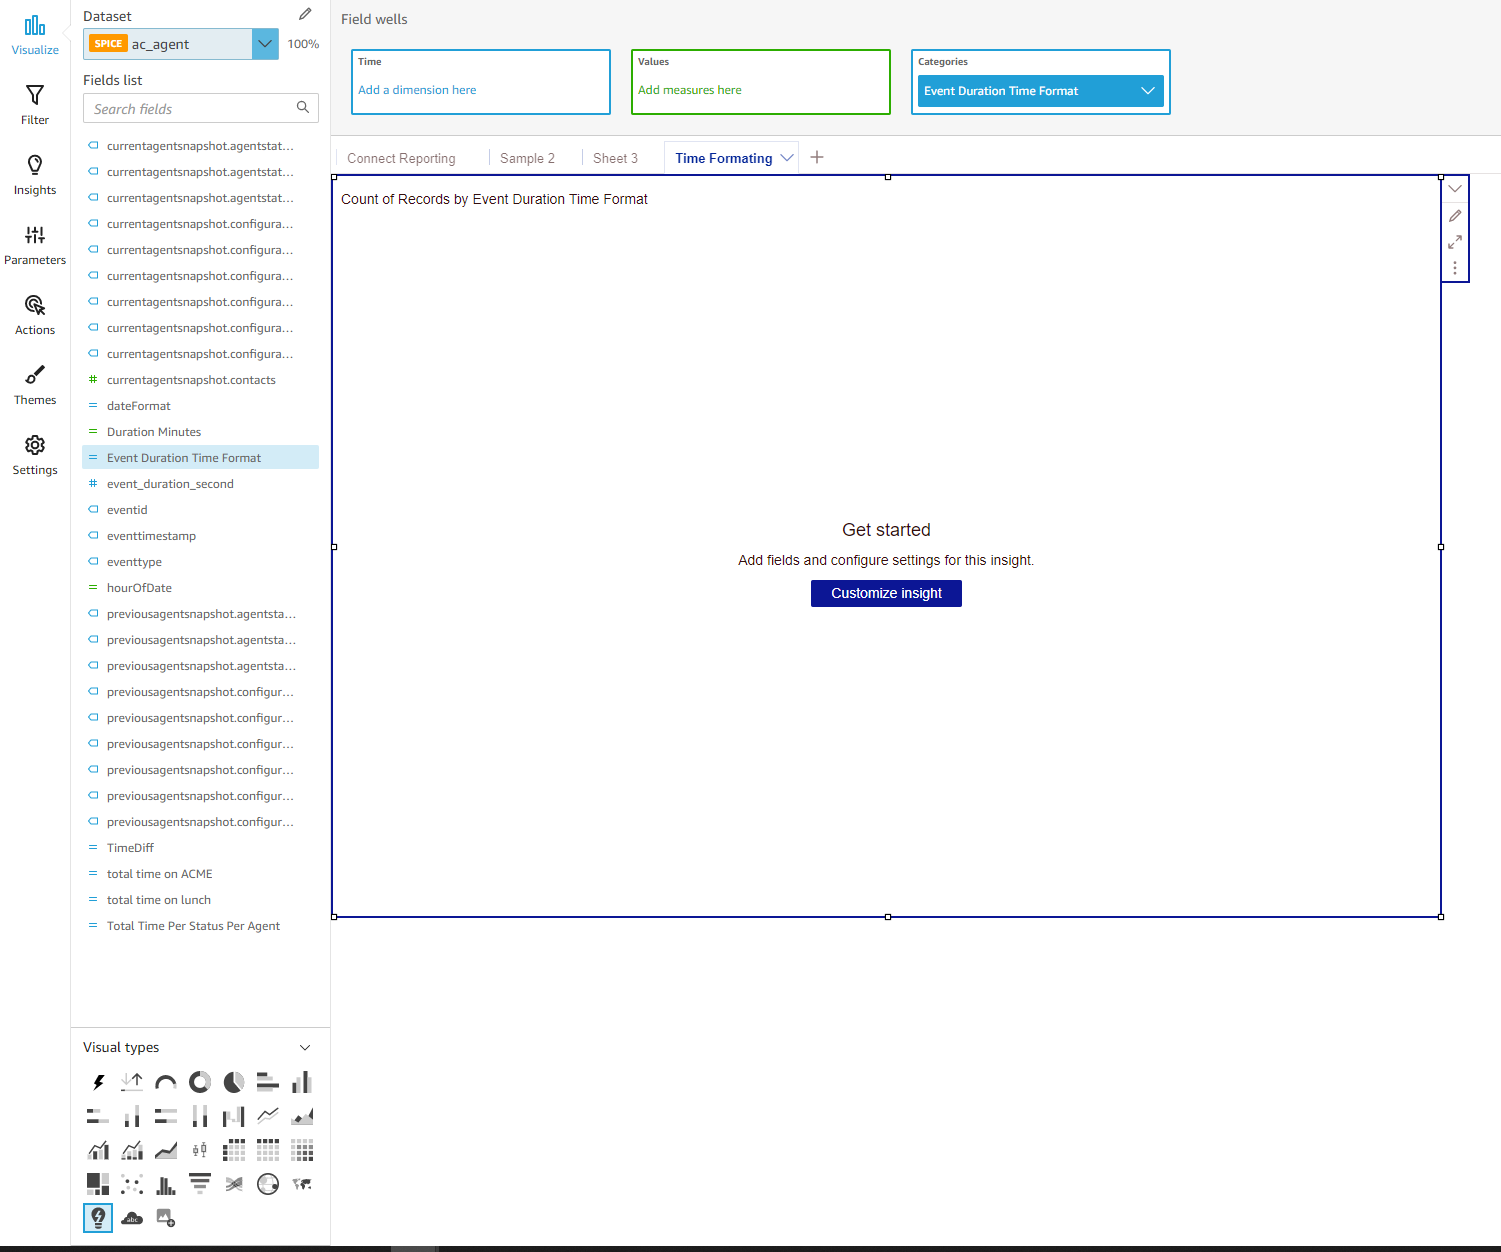
Introducing insights. We’ll walk you through how to calculate this field here. If we click on the Event Duration Time Format and change the Visual types to Insight here we’ll see this.
But if we try to put our calculated field into the Values page, it will still show us a count or count distinct! Was all of what we did previously wasted? Actually, no. It’s the same calculated field, but it now needs to be in insights. I will show you how to do that now.
Take out “Event Duration Time Format” and put in event_duration_second into the values page for Values in insights. Now you can change the duration to be sum, average, and all other great number formats we want to look at.

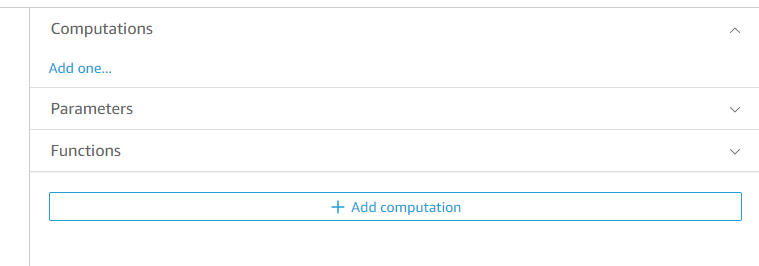
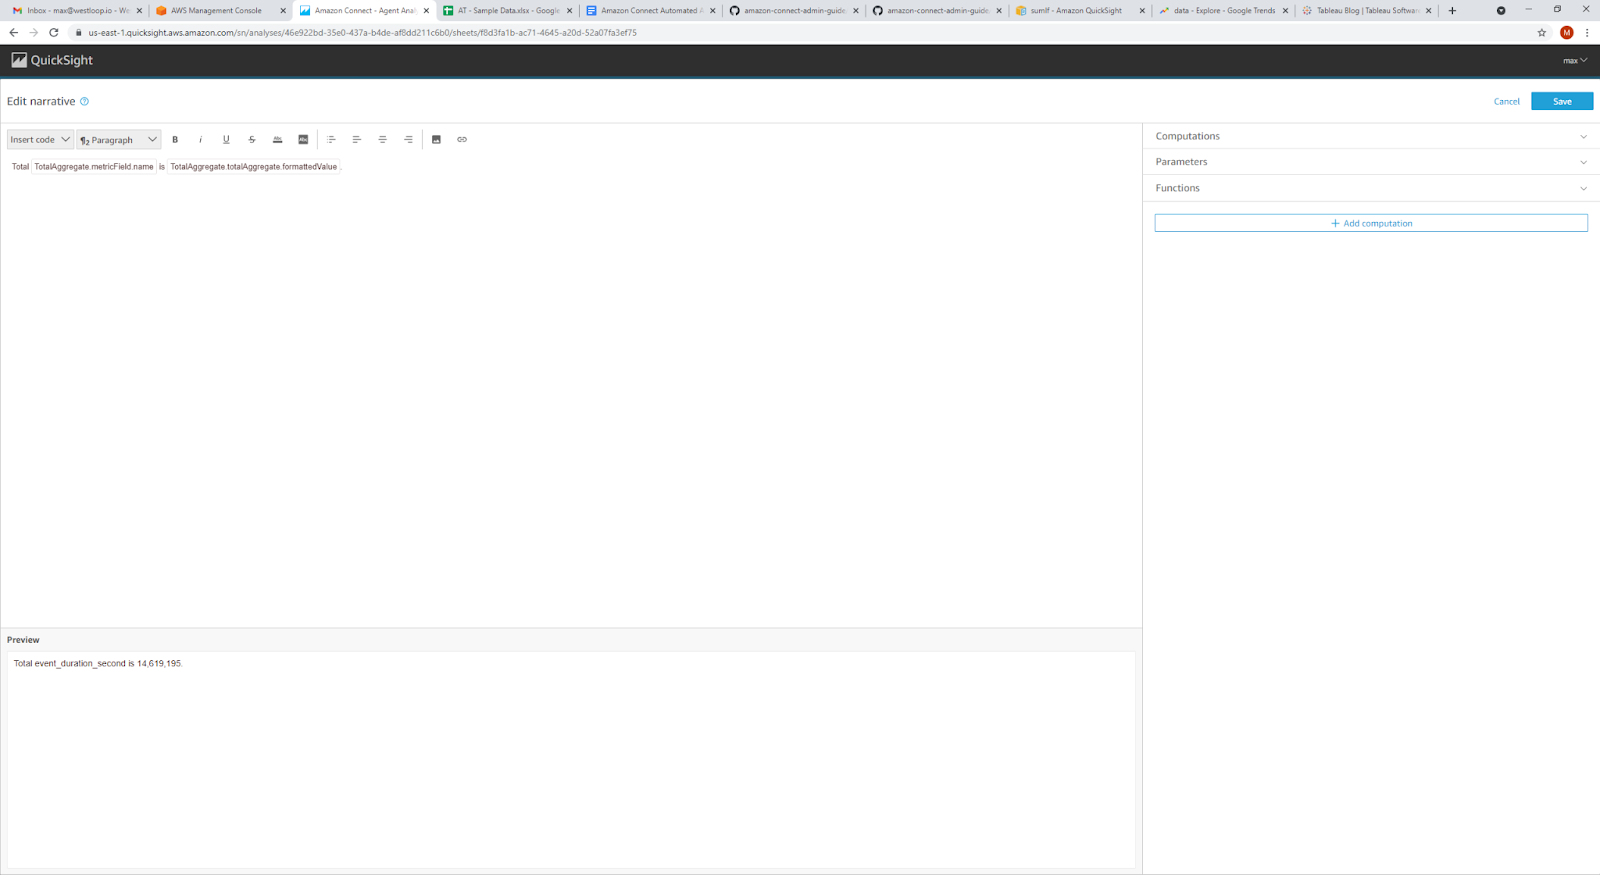
After deciding what metric you want to use, we can then pretty this up. We are using the sum for this example. Click on Customize insight. Once you are in, go to the right and click on Computations and add one.
Then we can look at the Computation type and we are going to look at the Total aggregation. Click that, and you will see the Value of event_duration_second (Sum). What is cool is that you can put in multiple values as well. So you can put in multiple fields and calculations in the top and reference them. If you want to compare different fields, feel free to do that.
I’m going to pick event_duration_second (Sum) total aggregation. After that, my screen populated with the message Total : TotalAggregate.metricField.name is TotalAggregate.totalAggregate.formattedValue. On the bottom of the screen you will see a preview of what it will look like in Quicksight. Mine says Total event_duraiton_second is 14,619,195.
Now here comes the part where we can make some cool calculations! On the top left, you will see a drop down menu called Insert code. Click on it and select Expression. We can now implement calculations on such code! If we click on the right tab under Functions, we will see a list of calculations. You can use all of these! We’re going to use our previous calculation to do the same thing with this calculation.
We’ll break it down a little bit differently for display purposes.
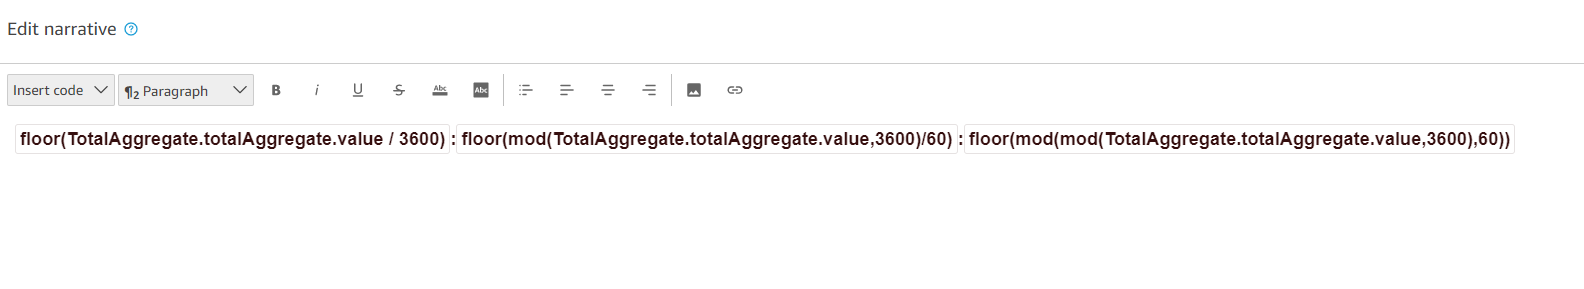
This will return the same numbers as our previous calculation. Mod is the same of % in a calculated field. What’s nice is that we can easily use our calculations with numbers and insert words, symbols or whatever we want before, in between or after. You can also format it to be in the center, left or right just like a word document.
Now save this insight and look at it through QuickSight.
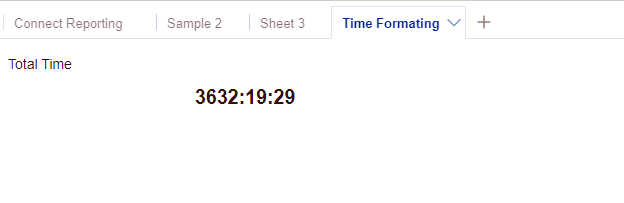
Wow, that number is pretty large! But we got our final formatting! If we wanted to we could even break this down by day as well. It would just change the calculations a little bit and that would be super easy with everything in place!
Moving on from here, this visualization can also be filtered and treated just like any visualization in QuickSight! For instance if we wanted to see the time for only a select group of people, organizations, or groups we could filter down on each! QuickSight will automatically change the value of the integer we passed into the insight. Feel free to play around with this amazing feature and see how you can customize your insights. There you have it! That’s how to show KPIs as strings and add some personal formatting to numbers.
Thank you for checking out this blog and we hope it helps you in your future QuickSight endeavors.