.svg)

Amazon Connect Analytics in QuickSight | West Loop Strategy

An organization's call center can make a massive difference to customer experience. Whether it is a business earning a sale or retaining a customer relationship, call centers are extremely important. The fact that more and more business systems are going online means the ability to talk to a customer service representative is increasingly important. Businesses must get their call center teams to be top performers, but it is not easy.
Call centers are complicated. They can be hard to set up and run. They demand an abundance of technology, both hardware and software. Since there is so much data that spins around a call center this can be intimidating and leave people wondering where to even start.
How can we look to drive efficiency and improve productivity while, most importantly, enhancing the customer experience?
Start With The Data: Amazon Connect
We want to make data-driven decisions. The best way to do that is gather as much information as possible, identify key conclusions, plan your strategy, measure success, and repeat.
An amazing tool for this is Amazon Connect. You can find a more in depth explanation and all the features of Amazon Connect here.
For this blog we are going to assume you have Amazon Connect set up. Once you start pulling in data, you will notice you are getting lots and lots of it! That’s great and what we want. But what does it all mean? And how do you turn that data into actionable business decisions that improve your customer experience?
With this mass quantity of data, you want to be able to focus on many different metrics for different groups of people. For instance, a break down of your analytics could be looking at total amount of:
- Missed Calls
- Interactions
- Inbound vs Outbound Calls
- Contacts put on hold
You also probably want to look know timed metrics such as:
- Interaction Time
- Hold Time
- Handle Time
- Abandon Time
- Answer Time
In addition, you may want to get even more granular and look at statistics of individual agents:
- Time Available, On Break, or Offline
- Time Online
- Total Contacts Abandoned vs Handled
- Disconnection Segments
All of this data and more is available at your fingertips with Amazon Connect! It’s an amazing product that will get you insight into all aspects of your call center, such as your top performers and areas to improve upon. If you do not know what is broken, how can you fix it? Amazon Connect will collect this data on exactly how your call center is performing on all levels.
If this data is just numbers in a database, it makes it very difficult to spot trends, find areas to improve on, or reward those who are performing extremely well. How can we not only display and synthesize all of this data, but make it very easy to understand and develop strategies?
Enter Amazon Connect Analytics powered by QuickSight
Amazon Connect Analytics by West Loop Strategy is a turn-key solution to harness data from your Amazon Connect instance within your AWS account. Amazon Connect Analytics creates automated data pipelines to feed a data lake, so you can kickstart analytics within your organization.
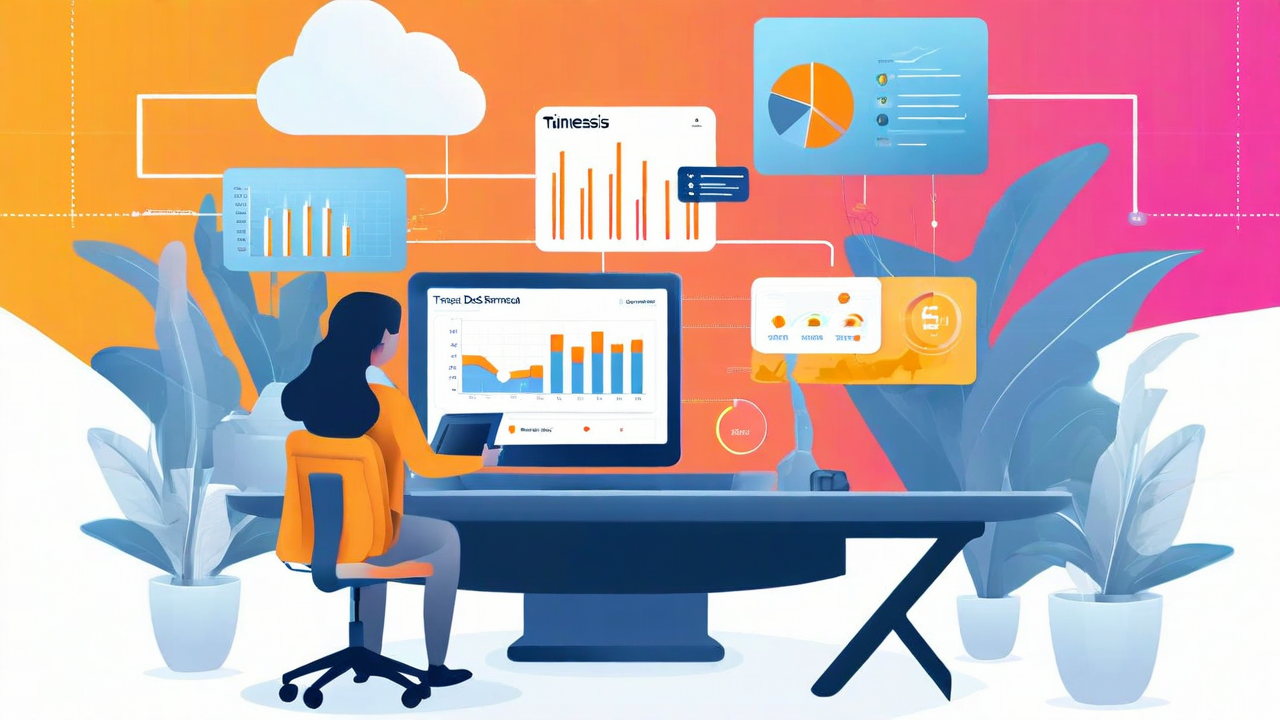
We can easily list out our main goals and their progress right here in front of your eyes. Let's see what a sample page of your dashboard would look like.

As you can see, from some of the numbers, there is an immense amount of data. However, we can now format that tower of data into meaningful tables and graphs so you can understand how you are operating and make smart decisions. You will also notice that many of your most important metrics are being displayed all in front of your eyes. Without you having to dig into the enormous amount data you are accumulating.
Our Amazon Connect dashboard is broken down to give you all the tools you need to understand your call centers efficiency. Front page metrics update every time you check on the dashboard. Updated to the minute. You also have access to another sheet where you can look back in time and dynamically change the dates you want to see your metrics for. Diving further, there are displays that look at today’s, this week’s, and this month's data all in one format to display how you are trending over time.
Visualize all the important data that you’ve been pulling from Amazon Connect with our new technology that syncs up to Amazon Connect to QuickSight.
What Can This Do For Your Organization?
Finally, you can start to make sense of all the data you are receiving. With Amazon Connect Analytics, you can now bring data visualizations to your Amazon Connect center.
Call centers, now more than ever, are essential to a business operating at optimum efficiency. Seeing areas of strength and areas of potential improvement has never been more important. Leveraging your call center with a tool like Amazon Connect is starting to become a necessity in this digital world. The final step is to connect all the data you receive and make sense of what is being given to you, so that you can make smart, informed, and impactful decisions. Amazon Connect Analytics powered by QuickSight can do just that.
Reach out to our team to learn more about this opportunity here.