.svg)

Amazon SageMaker AI Announces New observability capability For Inference Endpoints

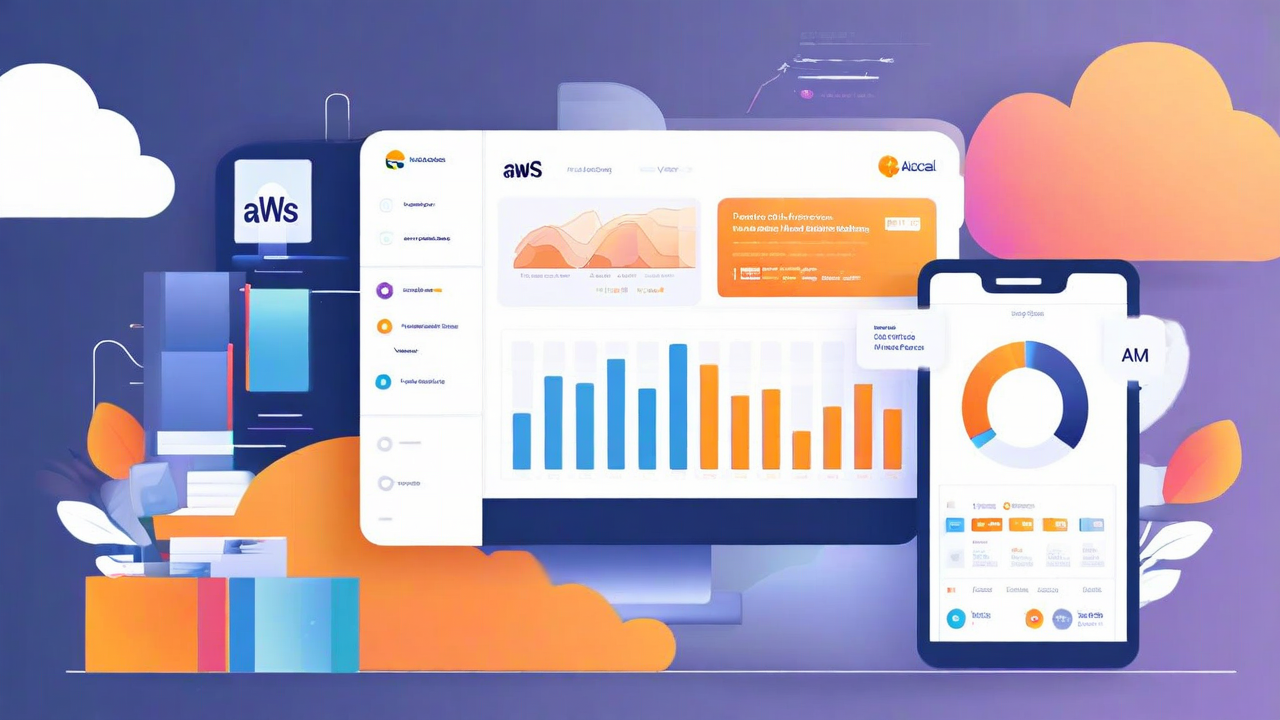
Amazon SageMaker AI Observability Capability
Amazon SageMaker AI's new observability capability provides comprehensive visibility into token performance, GPU health, inference component placement, and autoscaling behavior for production generative AI inference workloads. This capability tracks real-time metrics including Time to First Token, inter-token latency, queue depth, and tokens per second, and surfaces them alongside infrastructure health to help customers identify and resolve issues quickly.
The new pre-built SageMaker AI Insights dashboard in Amazon CloudWatch offers token latency, GPU utilization, inference component copy counts, scaling events, and cold start breakdowns in a single view. Customers can connect directly using the regional PromQL endpoint and import a pre-configured dashboard template if they use observability tools like Grafana.
Available Regions
- US East (N. Virginia)
- US East (Ohio)
- US West (Oregon)
- US West (N. California)
- Canada (Central)
- South America (São Paulo)
- Europe (Ireland)
- Europe (Frankfurt)
- Europe (London)
- Europe (Stockholm)
- Europe (Zurich)
- Asia Pacific (Mumbai)
- Asia Pacific (Singapore)
- Asia Pacific (Sydney)
- Asia Pacific (Tokyo)
- Asia Pacific (Seoul)
- Asia Pacific (Jakarta)
Source: AWS release notes
If you need further guidance on AWS, our experts are available at AWS@westloop.io. You may also reach us by submitting the Contact Us form.