.svg)

Amazon CloudWatch launches OTel Container Insights for Amazon EKS
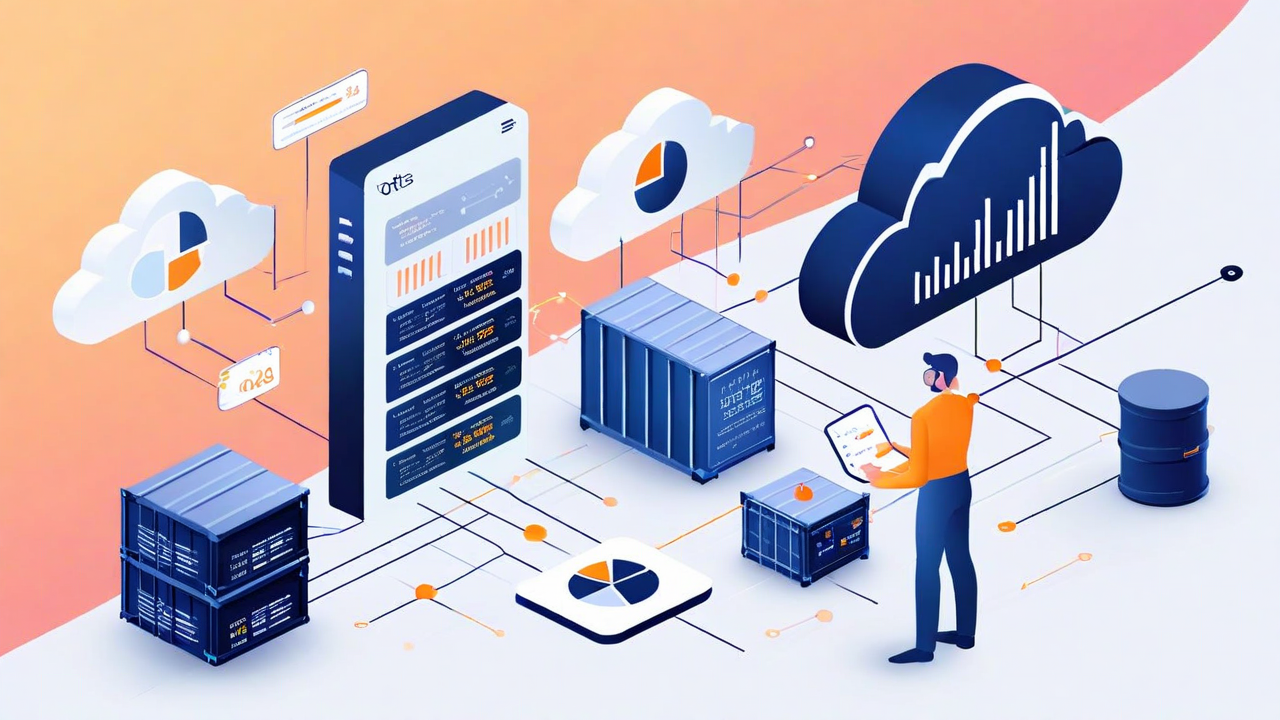
CloudWatch OTel Container Insights for Amazon EKS
CloudWatch OTel Container Insights for Amazon EKS collects infrastructure metrics at 30-second granularity using open-source receivers including cAdvisor, Kube State Metrics, and NVIDIA DCGM. Each metric carries OpenTelemetry semantic conventions and Kubernetes labels, making it straightforward to correlate across nodes, pods, and workloads in a single PromQL query.
Pre-built dashboards give you immediate visibility into cluster health, node performance, and pod-level resource usage. The CloudWatch PromQL endpoint lets you connect existing Prometheus and Grafana dashboards directly to CloudWatch.
What to do
- Enable it from the EKS console or via the CloudWatch Observability add-on (v6.2.0+), Helm, or CloudFormation.
Available in all commercial AWS Regions except Middle East (UAE), Middle East (Bahrain), and Israel (Tel Aviv). For pricing details, see the Amazon CloudWatch pricing page. To get started, see the OTel Container Insights documentation.
If you need further guidance on AWS, our experts are available at AWS@westloop.io. You may also reach us by submitting the Contact Us form.